
Public Pensions
Williamson Central Appraisal District (WCAD) is committed to public pension transparency. We have been a member of the Texas County and District Retirement System (TCDRS) since July 1991. Established by the Texas Legislature in 1967, TCDRS provides retirement, disability, and survivor benefits to employees of Texas counties and districts. Today, TCDRS serves 891 participating employers across the state, including counties, water districts, hospital districts, Appraisal Districts, emergency services districts, and more.
As of December 31, 2024, TCDRS reported $51 billion in net plan assets and maintained a funded ratio of 90%—or 97% when reserves are included—demonstrating its strong financial position and commitment to long-term sustainability.
Percentage of Salary Texas County & District Retirement System (TCDRS) Replaces at Retirement
The TCDRS benefit is based on employee deposits, which earn 7% compound interest each year, and employer matching at retirement. The following chart shows the estimated TCDRS benefit as a percentage of final salary prior to retirement for a new hire:
The change in the Unfunded Actuarial Accrued Liability (UAAL) attributable to each year is amortized over a closed 20-year period, except for the following situations:
-
- The UAAL attributable to benefit increases in a given year is amortized over a closed 15-year period.
- If there is an Over-funded Actuarial Accrued Liability (OAAL), the amortization period is an open 30-year period.
- If a UAAL decrease occurs due to extra employer contributions (lump sum or elected rate greater than required rate) or an actuarial gain, that decrease is offset against the oldest existing actuarial loss layer. For UAAL layers with a date established December 31, 2022, or earlier, the amortization is a level percent of payroll; for layers that are established after that date, the amortization is on a level dollar basis. If a UAAL exists, the amortization method is projected to eliminate the UAAL and reach a funded ratio of at least 100% in 20 years or less.
| Reasons for Rate Change | 2021 – 2022 | 2022 – 2023 | 2023 – 2024 | 2024 – 2025 |
| Beginning Rate | 16.75% | 18.10% | 17.94% | 17.41% |
| Plan Changes Adopted | 0.29% | 0.00% | 0.00% | N/A |
| Investment Return | 0.06% | -0.23% | 0.34% | 0.02% |
| Elected Rate/Lump Sum | -0.48% | -0.07% | -0.10% | -0.16% |
| Demographic/Other Changes | -0.28% | 0.50% | -0.77% | -0.55% |
| Assumption/Methods | 1.76% | -0.36% | 0.00% | 0.00% |
| Actual Determined Contribution | 0.00% | 17.94% | 17.41% | 16.72% |
| Actual Total Contribution Rate | 19.00% | 19.00% | 19.00% | 19.00% |
| Amortization Period | ||||
| Valuation Year | 2020 | 2021 | 2022 | 2023 |
| Funded Ratio | 85.50% | 86.30% | 86.50% | 87.10% |
Assumptions
- Employees are new hires and will work for you until retirement.
- Your current plan provisions will remain in effect through an employee’s retirement.
- Current laws governing TCDRS will continue as they are.
- Graded salary scales give bigger raises early in careers, with smaller raises later in careers (see the most recent Summary Valuation Report) from TCDRS .
- Based on Single Life benefit.
Actuarial Value of Assets vs. Actuarial Accrued Liability
The actuarial value of assets is equal to the employer assets (Employees Saving Fund (ESF) plus Subdivision Accumulation Fund (SAF)) adjusted for a five-year recognition of the difference between the expected and actual interest credited to the employer assets for each year. The prior year’s deferred actuarial gains and losses are increased by one year’s interest based on the prior year’s investment return assumption. In cases where there are deferred actuarial gains in the prior year, any current year actuarial loss is offset against the oldest actuarial gain. If any of the current year actuarial loss remains after the initial offset, the remainder is offset against the next oldest gain, and so on. If there are deferred actuarial losses in the prior year and there is an actuarial gain for the current year, the current year gain is offset against the prior actuarial losses in a similar fashion.
| Plan Year | Actuarial Accrued Liability (AAL) | Actuarial Value of Asset | Unfunded/(Over-Funded) AAL | Funded Ratio |
| 2025 | $38,418,808 | $33,468,593 | $4,950,215 | 87.10% |
| 2024 | $36,021,736 | $31,149,134 | $4,872,602 | 86.50% |
| 2023 | $38,418,808 | $33,468,593 | $4,950,215 | 87.10% |
| 2022 | $36,021,736 | $31,149,134 | $4,872,602 | 86.50% |
| 2021 | $34,068,763 | $29,399,265 | $4,669,498 | 86.30% |
| 2020 | $0 |
Long-Term Investment Goals
The long-term expected rate of return on TCDRS assets is determined by adding expected inflation to expected long-term real returns and reflecting expected volatility and correlation. The capital market assumptions and information shown below are provided by TCDRS’ investment consultant, Cliffwater LLC. The numbers shown are based on January 2024 information for a 10-year time horizon.
Note that the valuation assumption for the long-term expected return is re-assessed in detail at a minimum of every four years and is set based on a long-term time horizon. The TCDRS Board of Trustees adopted the current assumption at their March 2021 meeting. The assumption for the long-term expected return is reviewed annually for continued compliance with the relevant actuarial standards of practice. Milliman relies on the expertise of Cliffwater in this assessment.
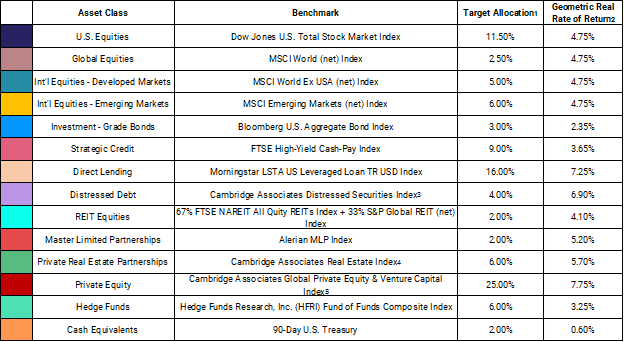
- Target asset allocation adopted at the March 2024 TCDRS Board Meeting.
- Geometric real rates of return equal the expected return for the assets class minus the assumed inflation rate of 2.2%, per Cliffwater’s 2025 capital market assumption.
- Includes vintage years 2005 – present of Quarter Pooled Horizon Internal Rate of Return (IRR).
- Includes vintage years 2007 – present of Quarter Pooled Horizon IRR.
- Includes vintage years 2006 – present of Quarter Pooled Horizon IRR.
Public Pensions Summary Table
| Funded ratio |
87.10% |
| Amortization period | 20 years |
| One-year rate of return | N/A |
| Three-year rate of return | N/A |
| 10-year rate of return | N/A |
| Assume rate of return | 7.5% |
| Unfunded Actuarial Accrued Liability (UAAL) as percent of covered payroll | 6.56% |
| Actuarially Determined Contribution (ADC) Rate (if plan has UAAL) with comparison to current Total Contribution Rates | 16.72% |